DataCo Supply Chain Analytics
Unlocking insights for a logistics company using Data Analysis to optimize operations and enhance customer satisfaction
Introduction
In today's competitive business landscape, supply chain analytics plays a pivotal role in driving efficiency, optimizing operations, and enhancing customer satisfaction. By leveraging data-driven insights, companies can make informed decisions that lead to improved performance and growth. In this article, we'll explore how I analyzed a comprehensive supply chain dataset to uncover key trends, identify areas for improvement, and provide actionable recommendations.
My goal was to transform raw data into meaningful insights that could guide strategic decision-making at DataCo Logistics, a leading supply chain management company. Through careful data transformation, visualization, and analysis, I aimed to answer critical questions such as:
- How is revenue performing compared to previous years?
- What are the most profitable product categories?
- How efficient is our delivery process?
- Which customer segments contribute the most to revenue?
By the end of this article, you'll have a clear understanding of how data analytics can drive tangible improvements in supply chain operations.
About the Dataset
The dataset provided for this project was initially structured as a single flat table containing 54 columns and 102,580 records. While this format made it easy to load into Power BI, it lacked the structure needed for efficient analysis. To address this, I transformed the dataset by splitting it into four distinct tables: Customers, Products, Orders, and Order Locations.
By restructuring the dataset into these four tables, I was able to create meaningful relationships between them, enabling cross-table analysis and deeper insights.

Interactive Filters
The dashboard includes interactive filters that allow users to drill down into specific time periods, product categories, and geographic regions.
Time Series Analysis
Advanced time series analysis helps identify seasonal patterns and year-over-year trends in revenue and order volume.
Geographic Visualization
Interactive maps display revenue distribution across different regions, helping identify high-performing markets.
Related Projects
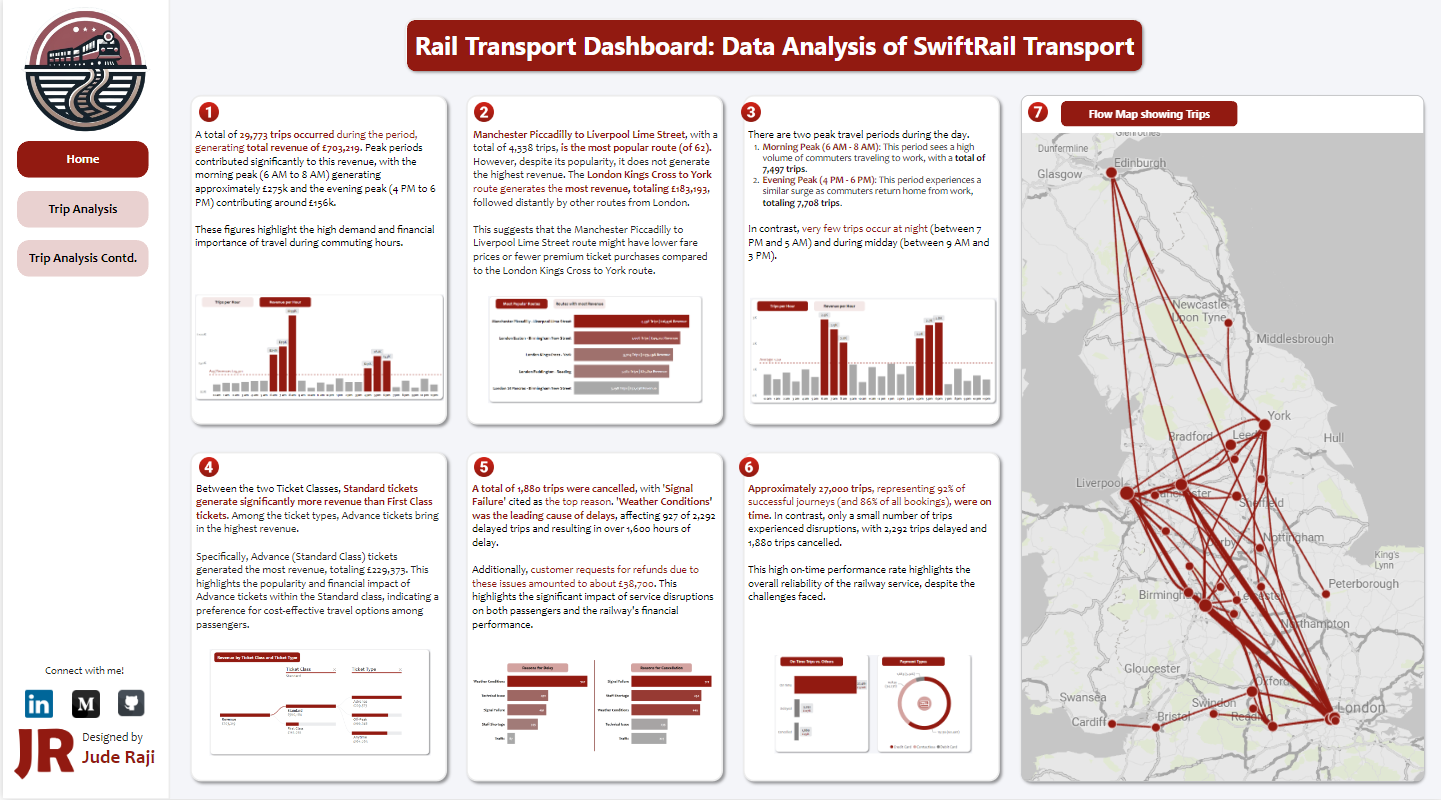
Rail Transport Dashboard
Comprehensive analysis of routes, peak times, revenue, and delays for SwiftRail Transport.
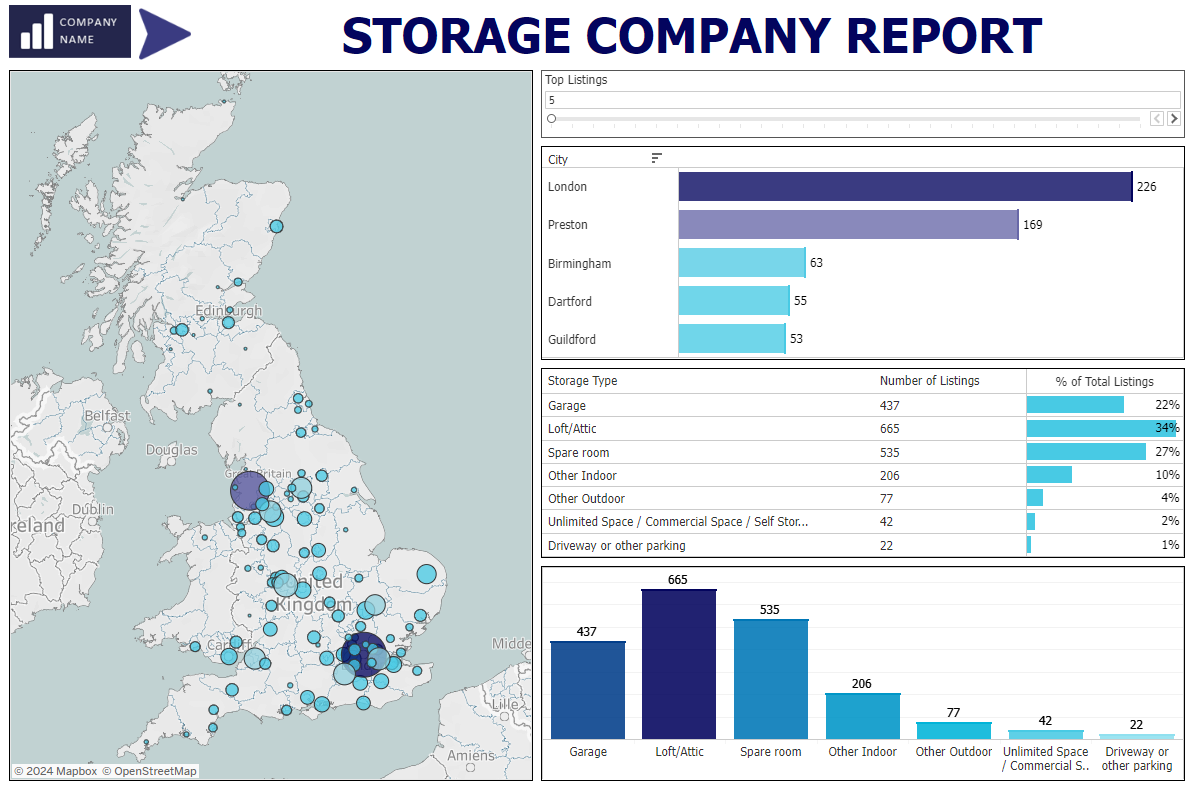
Storage Company Geo-Location Analysis
Visualizing storage locations and market distribution across the UK for a storage services company.
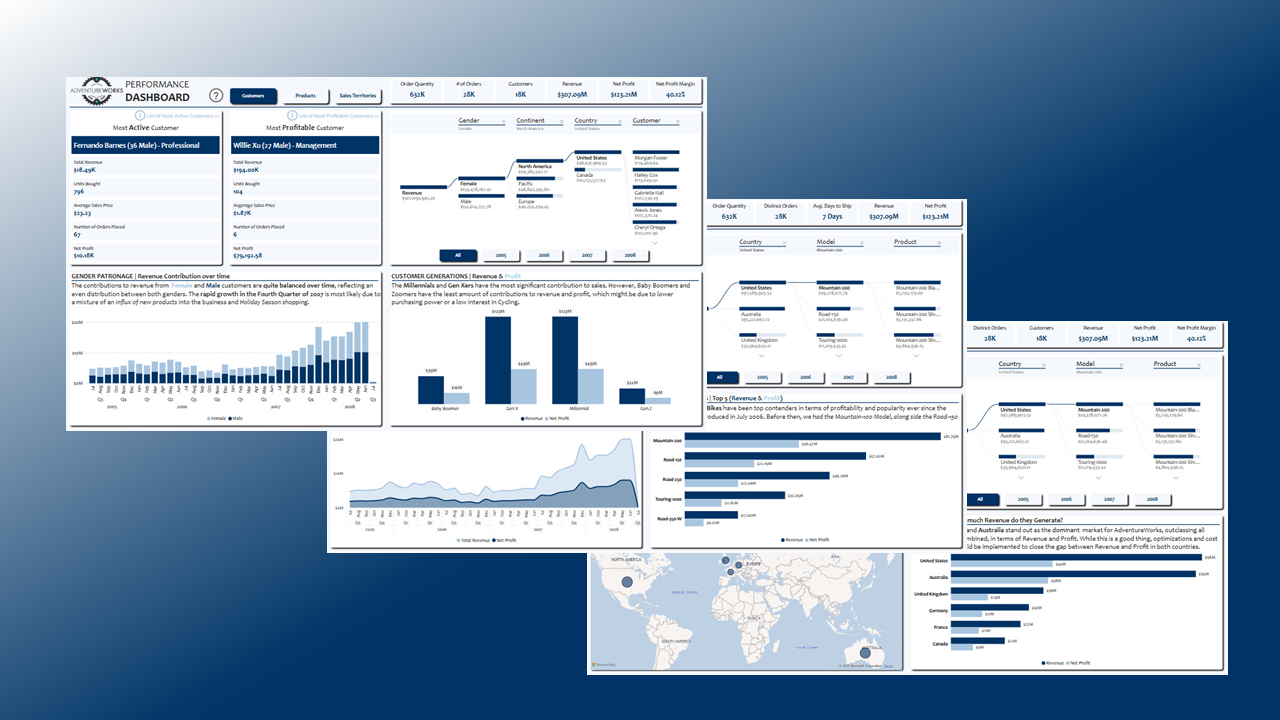
AdventureWorks Sales Insights
Comprehensive customer and sales analysis for a bicycle company using Power BI.