
Customer churn analysis · Banking
Bank Customer Churn Analysis
Who leaves a bank, why they leave, and what a retention strategy should target.
Introduction
Customer churn is a major challenge for banks, affecting revenue and increasing customer acquisition costs. Understanding why customers leave and what factors contribute to churn can help banks implement effective retention strategies. In this project, I analyzed customer churn data from a fictional bank to uncover key insights and recommend data-driven solutions for improving customer retention.
Problem Statement
High customer churn can indicate dissatisfaction, unmet expectations, or poor customer engagement. The goal of this analysis is to identify key drivers of churn and provide actionable recommendations for customer retention. Specifically, we aim to answer the following questions:
- What customer demographics and behaviors are most associated with churn in a bank?
- Does product engagement (number of bank products owned) influence churn rates?
- Are tenure and credit score significant indicators of churn in banking?
By answering these questions, we can provide insights into how banks can improve customer loyalty and reduce churn.
About the Dataset
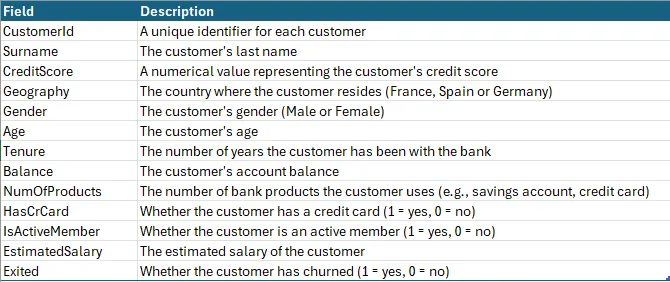
The dataset used for this analysis contains information about bank customers, including demographic details, account activity, and churn status. Below are the key fields:
Data Cleaning and Transformation
Before analysis, the dataset was preprocessed to ensure accuracy and consistency. Key steps included:
- Removed Duplicates: I removed records that were entered repeatedly in the dataset.
- Standardizing Data Types: Ensured all data types (especially currencies, and dates) were properly formatted.
- Feature Engineering: Creating new variables such as "Churn Rate" based on existing data.
The dashboard
Light and dark modes
Light Mode
Dark Mode
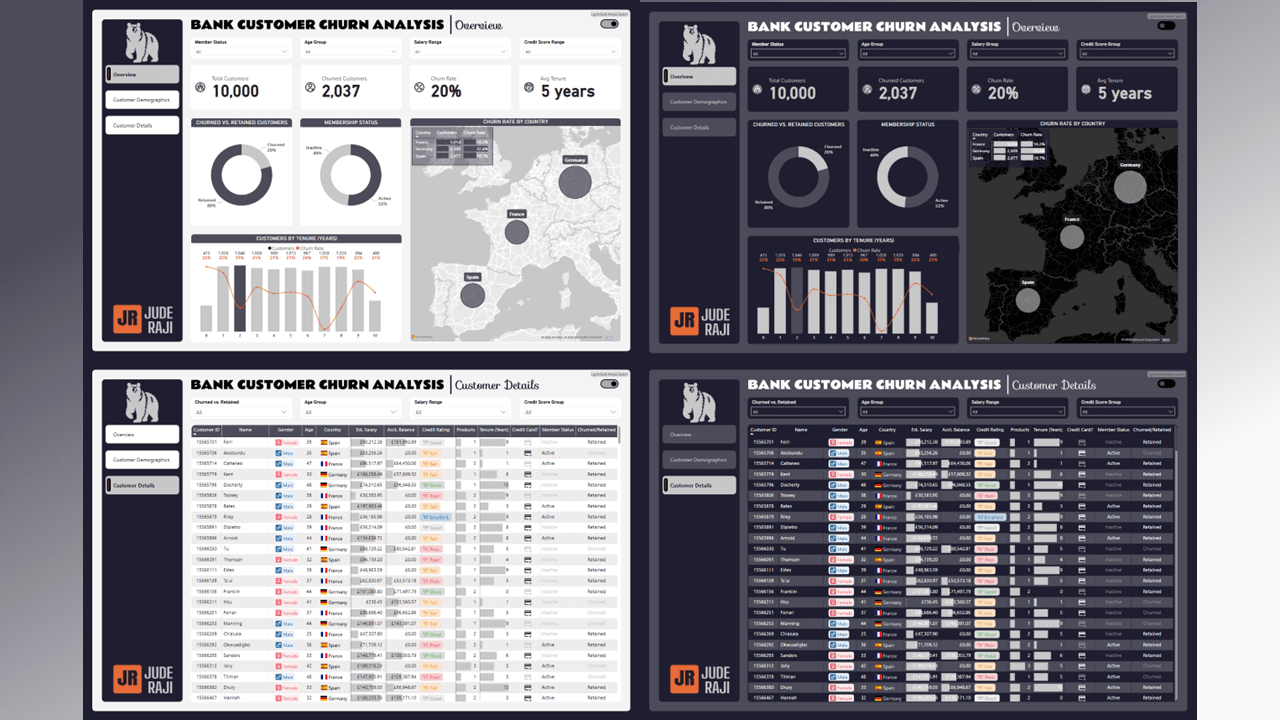
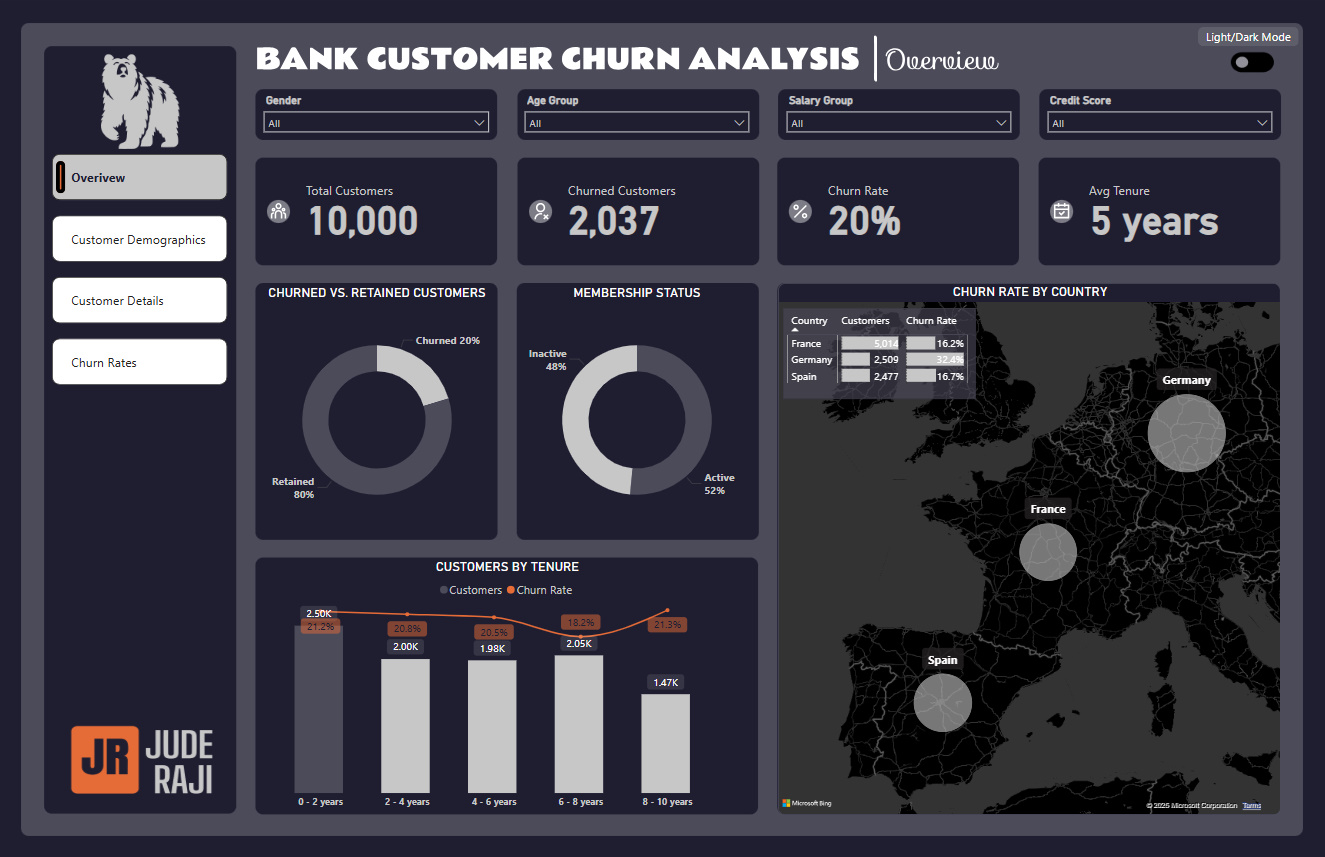
For extra functionality, I added a Light/Dark Mode Switch to all pages. You can experience the entire dashboard in either mode at the touch of a button.
Customer Details page and use of SVG icons
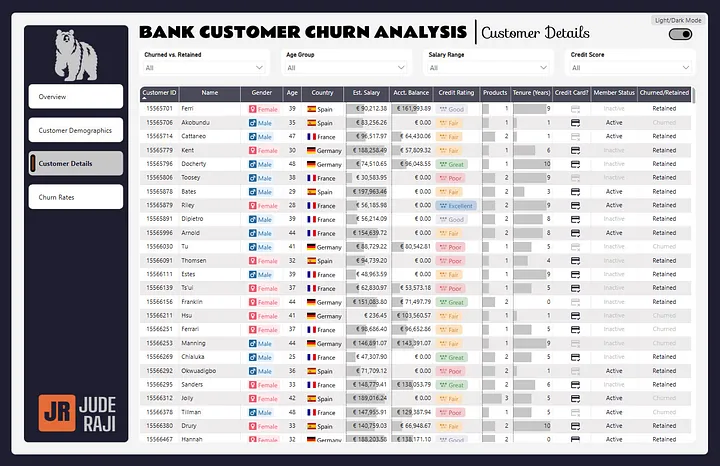
Following inspiration from Zsolti on YouTube (Channel Name: Your Own KPI), I learned to create SVG Icons using Figma and use them in my Power BI tables. He's a great teacher and you can check out his channel for more.
Insights from the Analysis
Our analysis provided several key findings:
1. Overall Churn Rate

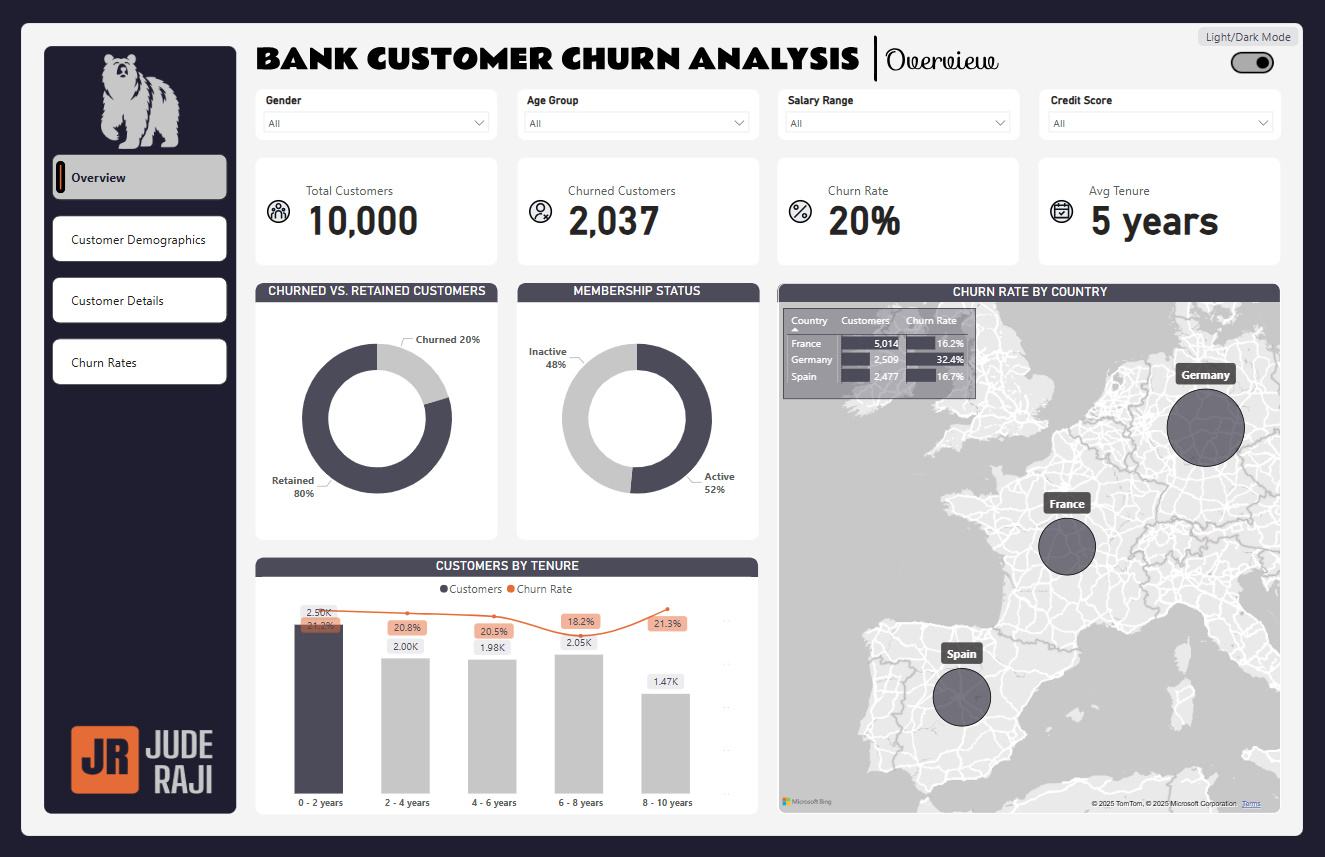
Out of 10,000 customers, 2,037 (20%) churned, while 80% remained with the bank. The average tenure of customers is 5 years.
2. Churn by Geography
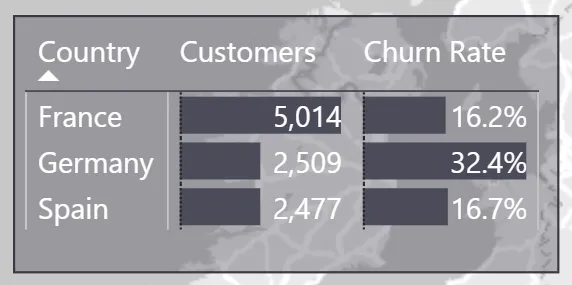
Germany has the highest churn rate at 32.4%, followed by Spain (16.7%) and France (16.2%). This shows that German customers may require more targeted retention efforts.
3. Churn by Tenure
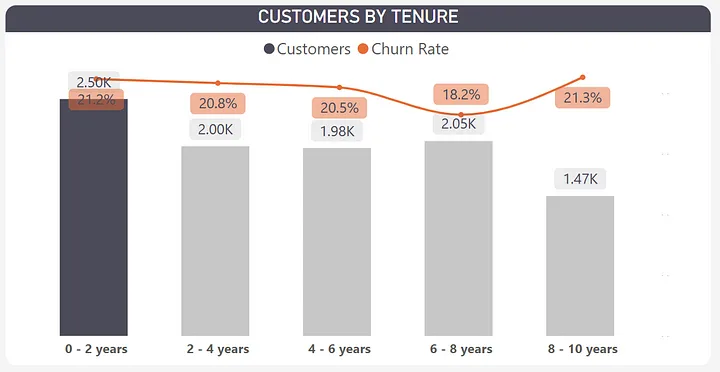
Early-stage customers (0–2 years) have a 21.15% churn rate, indicating onboarding and engagement challenges. Churn remains between 18%-21% across all tenure groups, meaning longevity does not guarantee loyalty.
4. Churn by Credit Score
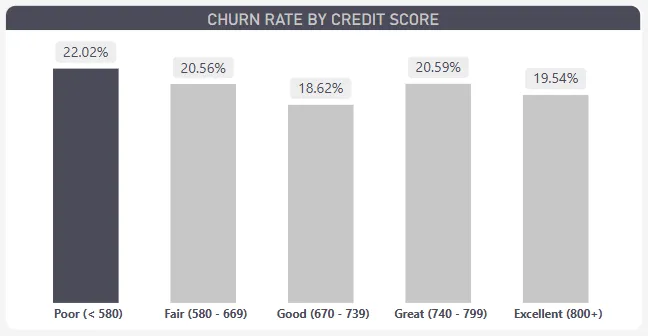
Customers with poor credit scores (<580) churn at 22%, the highest among all credit score groups. Even customers with excellent credit scores (>800) churn at 19.54%, showing that creditworthiness is not a sole indicator of retention.
5. Churn by Number of Products
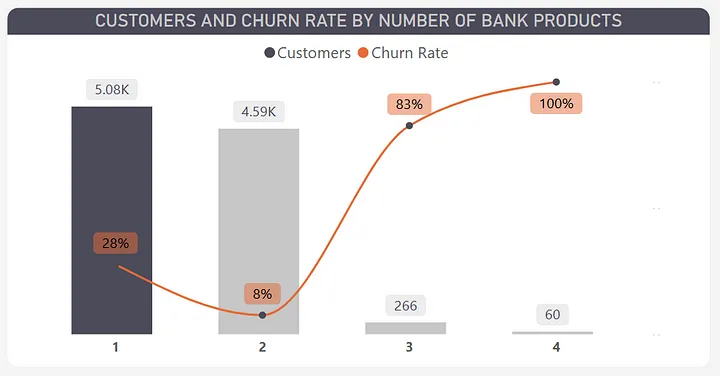
Customers with only one product churn at 28%, while those with two products have an 8% churn rate. Churn spikes to 83% for customers with 3 products and 100% for those with 4 products, suggesting dissatisfaction or improper targeting.
6. Churn by Age Group
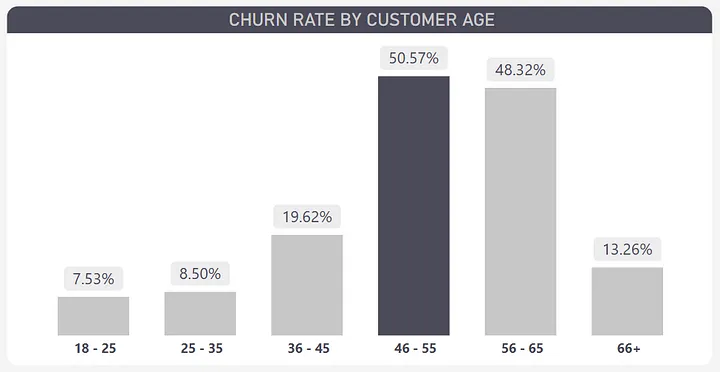
46–55-year-olds have the highest churn rate (50.57%), followed by 56–65-year-olds (48.32%). Young customers (18–35) churn the least (7.53%-8.5%), possibly due to growing financial needs and product engagement.
7. Churn by Membership Status
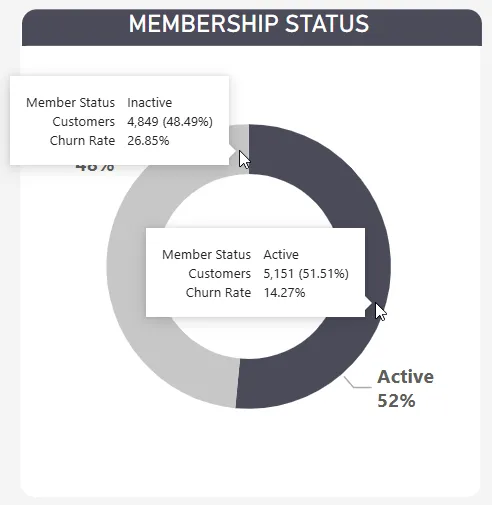
Inactive customers are at higher risk of churning (27%) compared to Active customers (14% churn rate), reinforcing the importance of engagement.
8. Churn by Salary Range
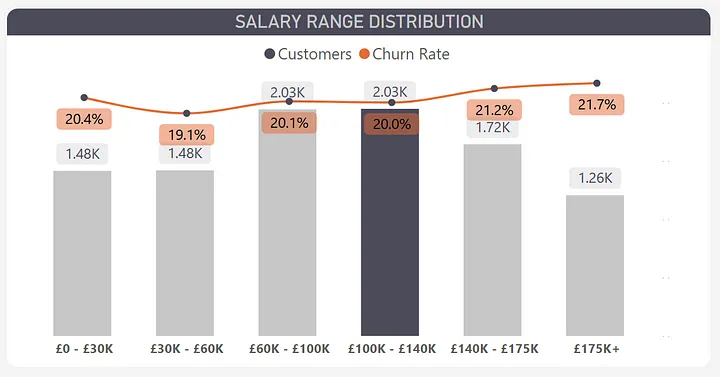
Customers across different salary ranges churn at similar rates (19%-22%), showing that income is not a strong churn predictor.
Summary of Insights
Based on our analysis, the key drivers of churn among bank customers include:
- Geographic Differences: Customers in Germany have the highest churn rate (32.4%), suggesting possible dissatisfaction with banking services or competitive alternatives in that region.
- Lack of Engagement: Nearly half of the customers classified as inactive (48%) are at a higher risk of leaving.
- Product Mismatch or Overload: While customers with one product churn at 28%, those with 3 or more products experience extreme churn rates (83%-100%), showing that the problem is either dissatisfaction or improper targeting.
- Demographic Factors: Mid-age customers (46–65 years) churn at the highest rates (50.57% and 48.32%, respectively). This group might require targeted programs.
- All customers regardless of credit score or salary, churn between 19% and 22%, suggesting that creditworthiness and Income do not determine retention.
Recommendations
Based on these insights, I recommend the following strategies to reduce bank customer churn:
Improve Early Engagement
Customers in their first two years are at high risk of churning. Personalized onboarding and proactive customer service can improve retention.
Investigate Multi-Product Churn
The high churn rates for customers with three or more products suggest a potential issue with product satisfaction. Conduct customer feedback surveys to identify pain points.
Focus on Mid-Age Customers
Targeted retention programs, such as loyalty rewards and personalized financial advice, can be beneficial to the 46-65 age group.
Re-engage Inactive Customers
Customers with high balances who are inactive represent a valuable segment. Re-engagement campaigns with exclusive offers may encourage them to stay.
1. Improve Early Engagement Strategies
Customers in their first two years are at high risk of churning. Implement the following:
- Personalized onboarding process with dedicated relationship managers
- Regular check-ins during the first 90 days
- Educational resources about banking products and services
- Early rewards for account activity and product adoption
2. Investigate High Churn Among Multi-Product Customers
The high churn rates for customers with three or more products suggest potential issues:
- Conduct customer feedback surveys to identify pain points
- Review product bundling strategies for better fit
- Analyze fee structures for multi-product customers
- Ensure proper customer education on product benefits
3. Focus on Retaining Mid-Age Customers (46–65 years)
This demographic shows the highest churn rates and requires targeted approaches:
- Develop loyalty programs specifically for this age group
- Offer personalized financial planning and retirement advice
- Create dedicated customer service channels
- Provide preferential rates on products relevant to this age group
4. Enhance Retention Efforts for High-Balance Inactive Customers
Inactive customers with high balances represent a valuable segment at risk:
- Develop re-engagement campaigns with exclusive offers
- Implement a tiered service model based on account balance
- Provide personalized financial reviews
- Offer premium services to encourage activity
Conclusion
Bank customer churn is a critical business challenge that can be addressed through data-driven insights. By analyzing key variables like credit score, tenure, product adoption, and customer age, banks can implement targeted strategies to retain customers and reduce churn. Continuous monitoring and data analysis will further enhance retention efforts and improve customer relationships.
More work
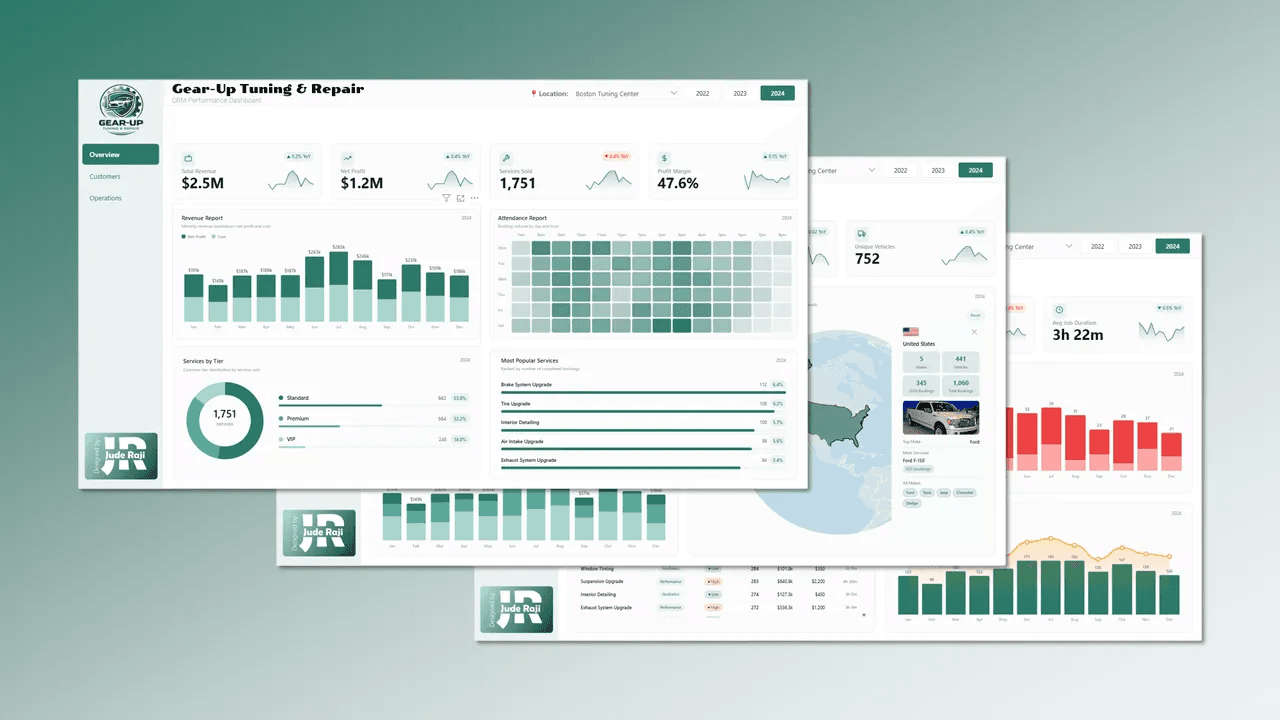
Gear-Up Auto Tuning & Repair
A three-page CRM dashboard covering revenue, customers and workshop operations for a multi-location auto repair business.
Power BI · DAX · HTML5 custom visuals · Figma
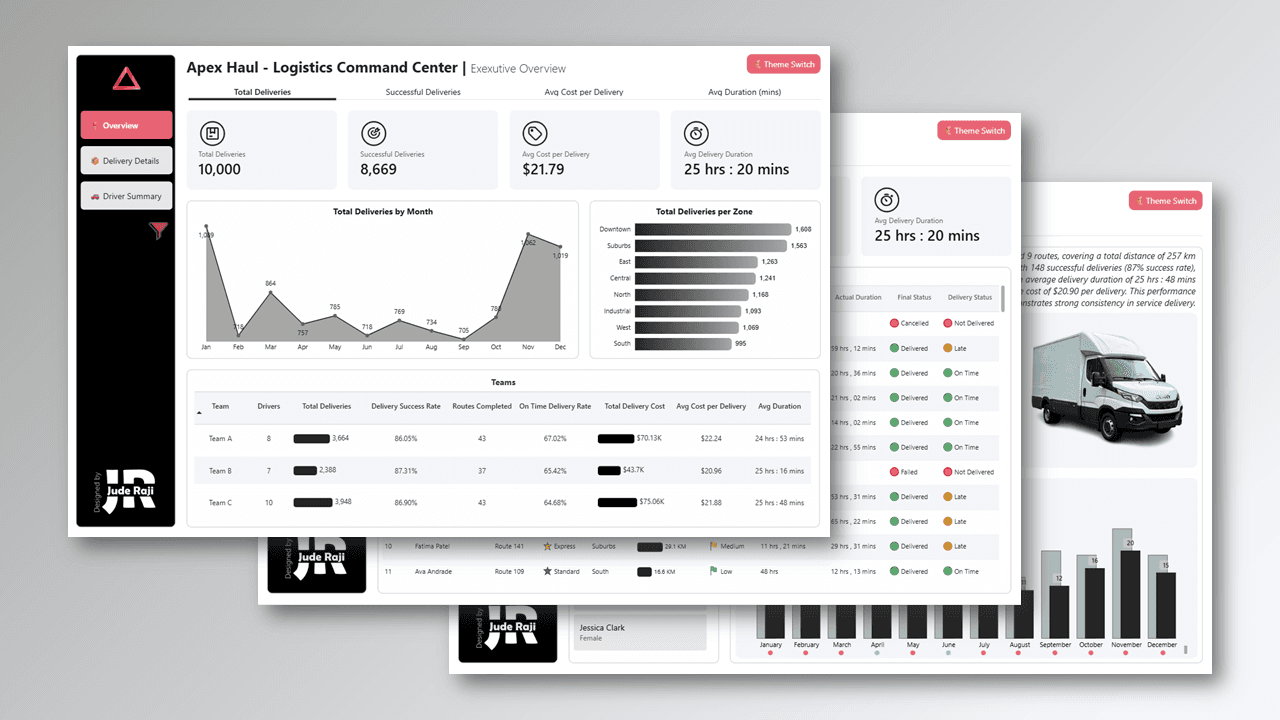
Apex Haul Logistics Command Center
An executive logistics dashboard covering 10,000 deliveries, driver performance and zone analytics.
Power BI · Python · Figma
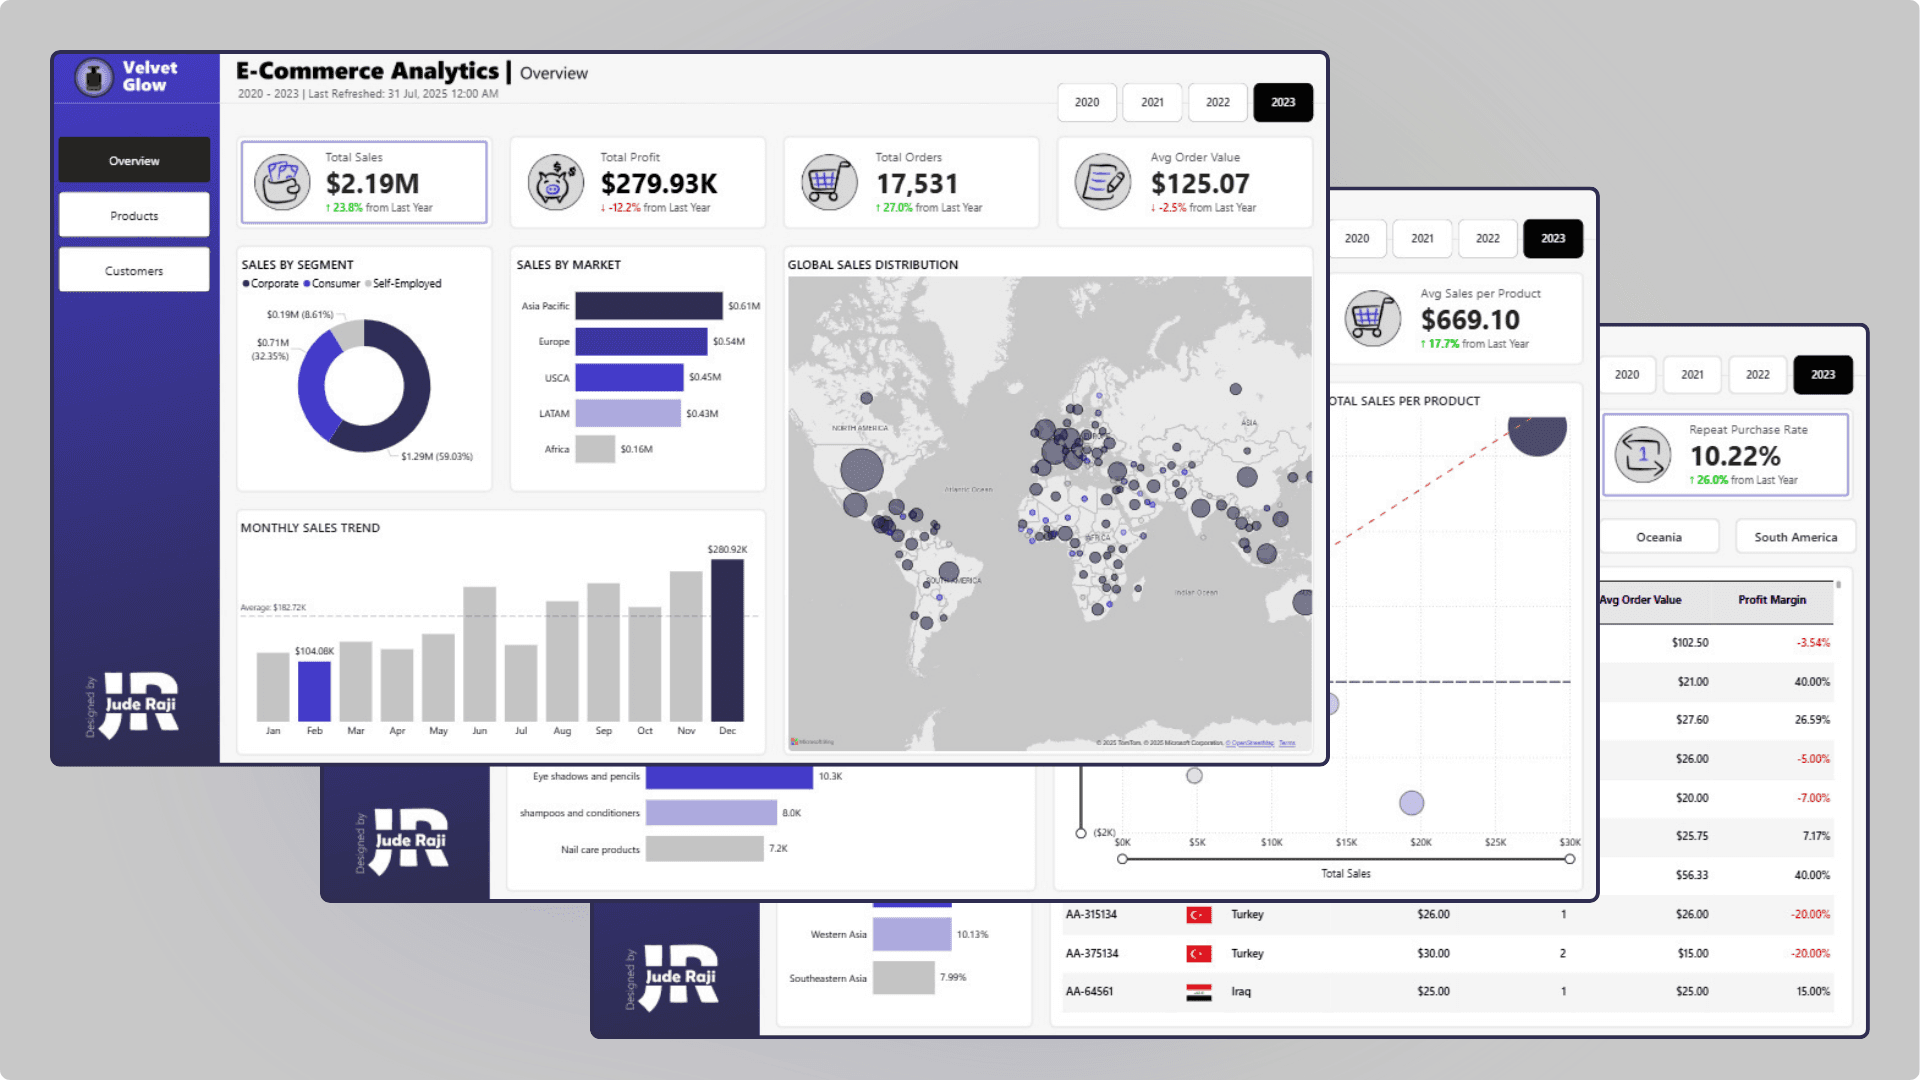
Velvet Glow E-Commerce Analytics
Sales, product and customer analytics for a global skincare and beauty retailer, built to tackle retention and profitability.
Power BI · Excel · Figma