
E-commerce sales analysis · E-commerce
Velvet Glow E-Commerce Analytics
Sales, product and customer analytics for a global skincare and beauty retailer, built to tackle retention and profitability.
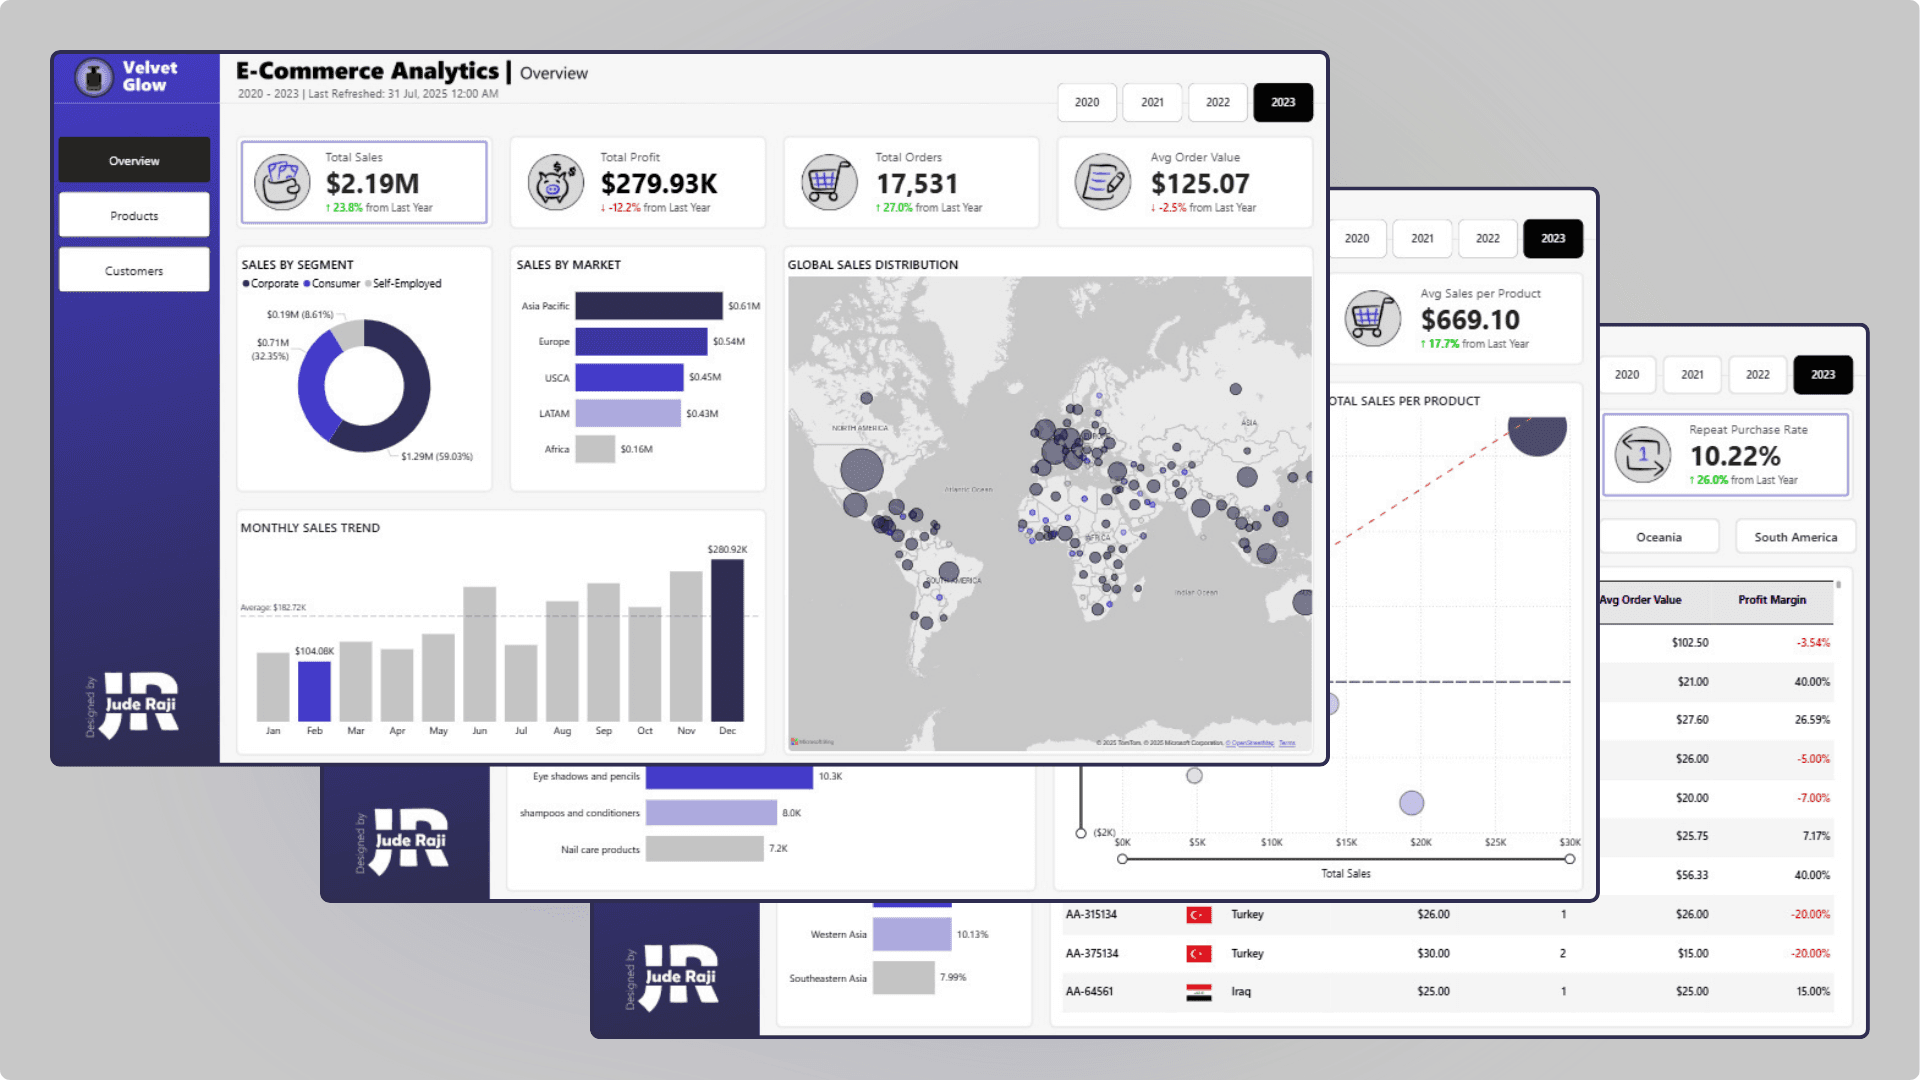
What if you could unlock the full potential of your e-commerce business?
This dashboard tackles the challenge of understanding Velvet Glow's global skincare and beauty performance, helping solve retention and profitability issues. It is a deep dive into the company's customer data from 2020 to 2023.
The dashboard
- Overview: total sales, total profit, total orders and average order value, with sales by segment, sales by market, the monthly sales trend and a global sales distribution map.
- Products: sales and profit for each product line.
- Customers: repeat purchase rate, regional breakdowns and order-level detail.
Bonus feature: click any KPI card to change the dashboard metrics.
Key insights
- Total sales reach $2.19M in 2023 after a steady yearly climb, with Body care (for example moisturisers) accounting for 37% of revenue.
- Profit margin, despite being positive (18%), is at an all-time low in 2023 after falling 2.3% from the previous year.
- Corporate customers have more than two times the collective average order value (AOV) of Consumer and Self-Employed customers in all regions.
- Customers in Africa present the lowest profit of all markets every year.
Recommendations
Implement targeted bundles
for Body care to push that 37% of revenue and get more repeat buyers.
Tweak profit plans
to stop the 2.3% margin slide and lift that 18% back up.
Create special deals
for Corporate customers to make the most of their high AOV everywhere.
Look into fixes
for the Africa market to deal with the low profit every year.
Tools used
- MS Excel for data cleaning.
- Power BI for analysis, dashboard creation and visuals (table, cards, bar chart, pie chart, map).
- Figma for background design.
More work
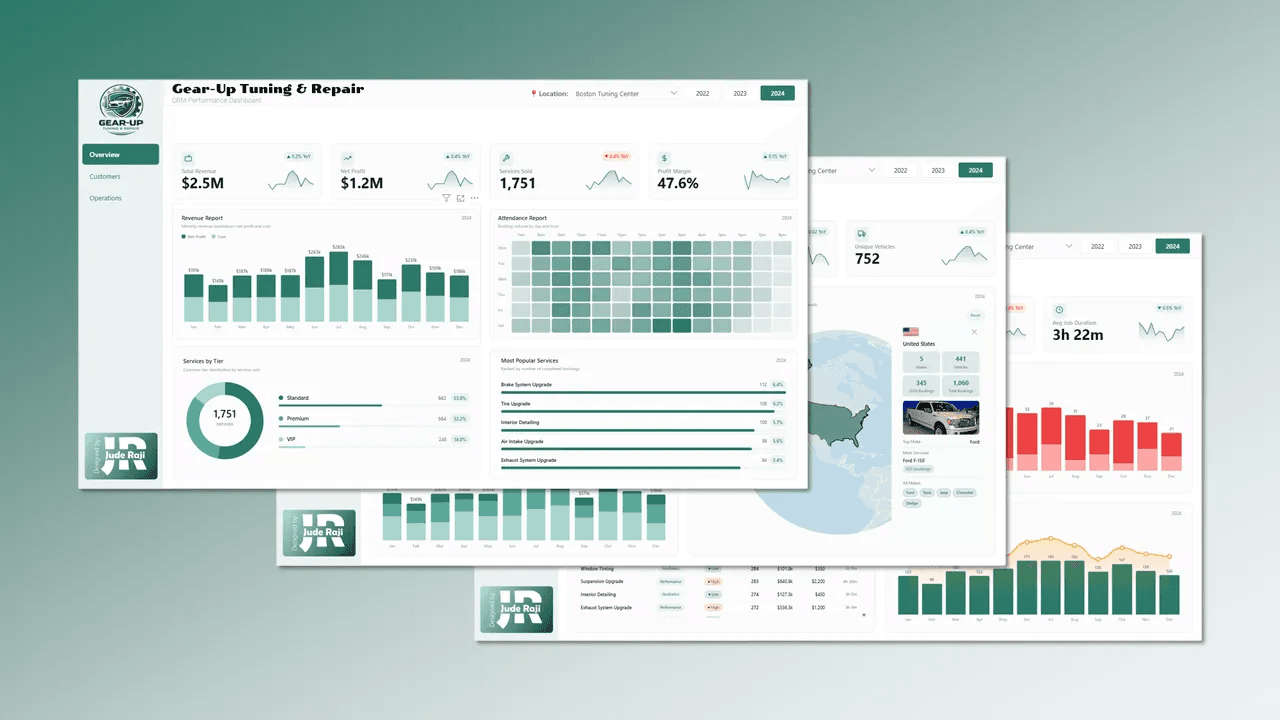
Gear-Up Auto Tuning & Repair
A three-page CRM dashboard covering revenue, customers and workshop operations for a multi-location auto repair business.
Power BI · DAX · HTML5 custom visuals · Figma
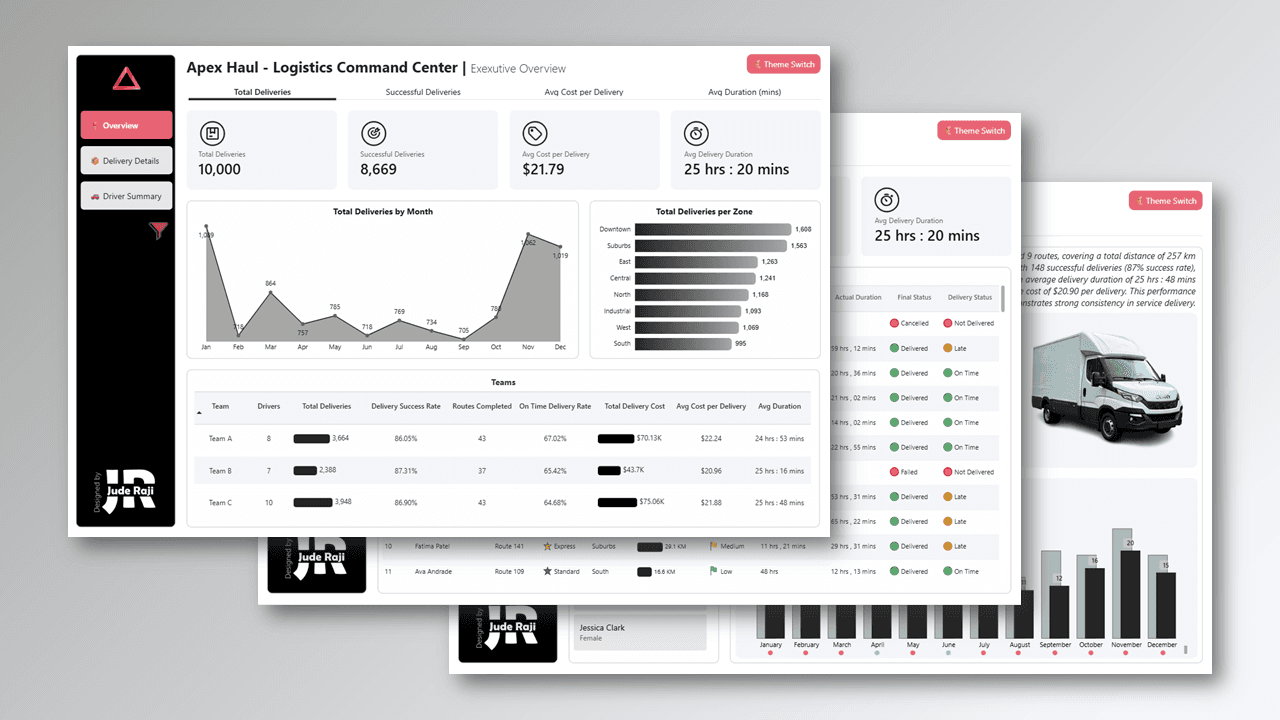
Apex Haul Logistics Command Center
An executive logistics dashboard covering 10,000 deliveries, driver performance and zone analytics.
Power BI · Python · Figma
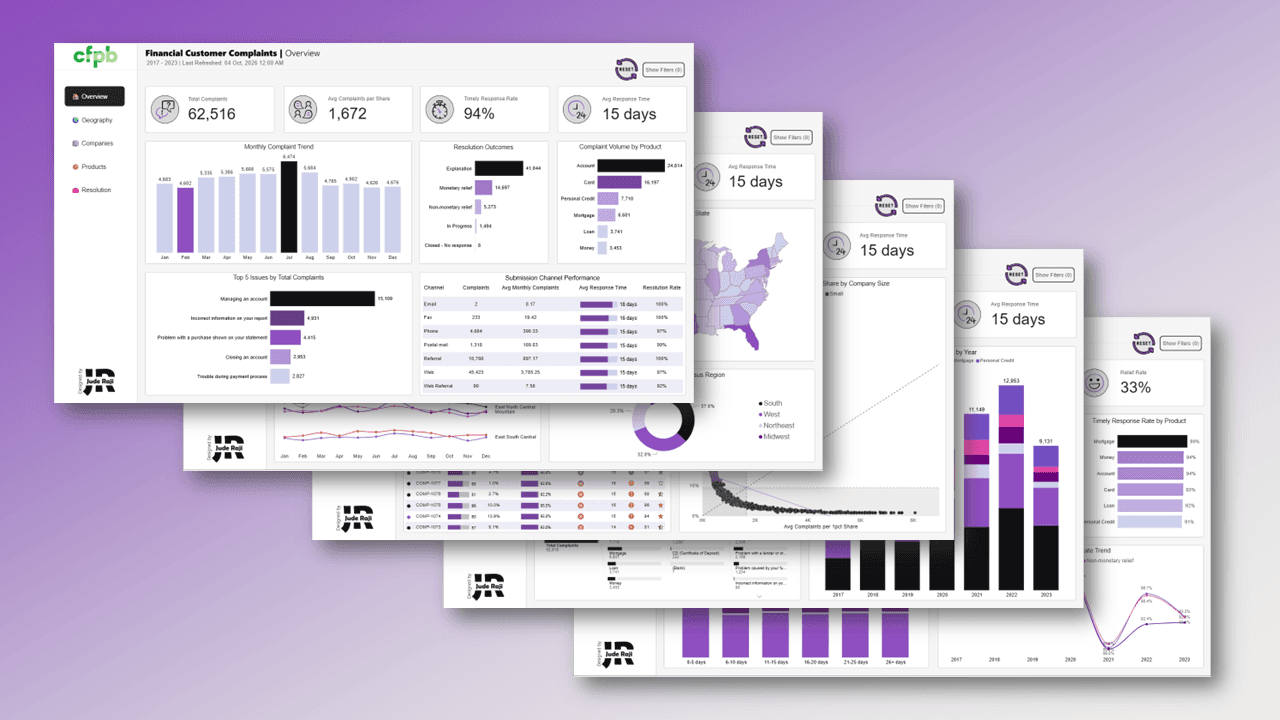
Financial Customer Complaints
Unpacking 62,516 US consumer financial complaints across 320 companies, showing where the system fails everyday customers.
Power BI · Excel · Figma