
Financial customer complaints analysis · Financial services
Financial Customer Complaints
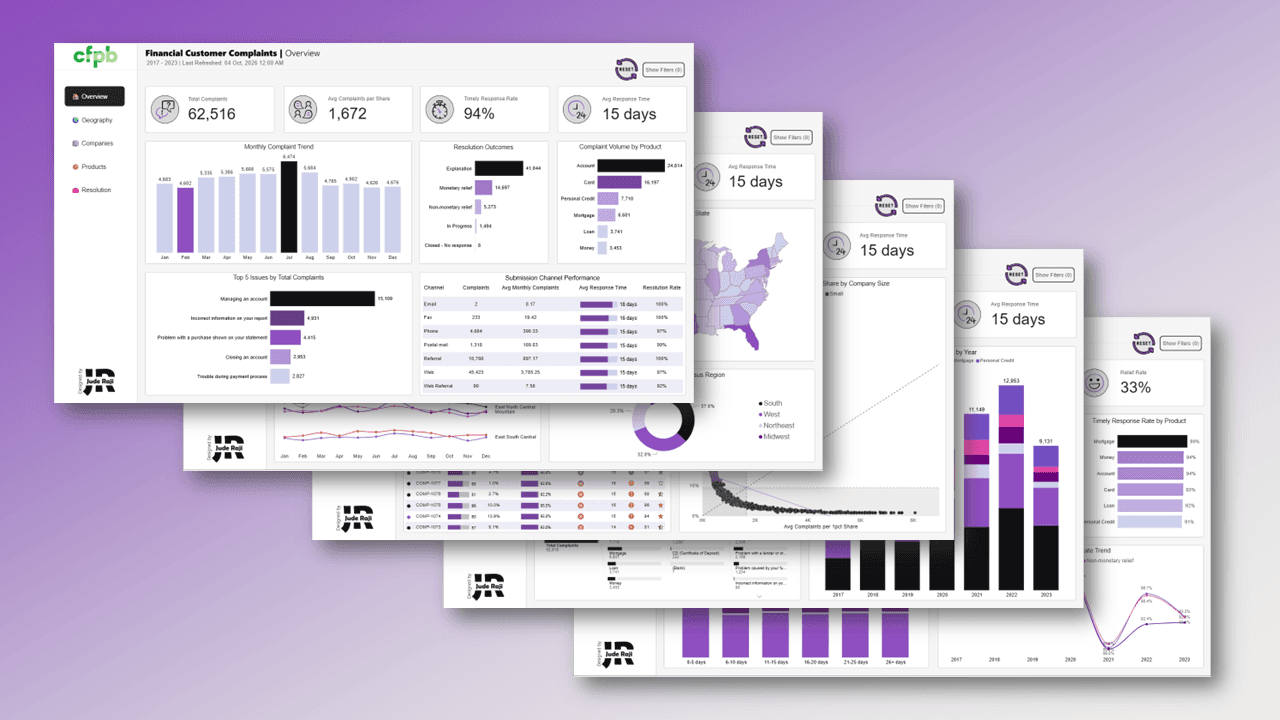
Unpacking 62,516 US consumer financial complaints across 320 companies, showing where the system fails everyday customers.
Introduction
A deep dive into more than 62,000 consumer grievances recorded by the U.S. Consumer Financial Protection Bureau (CFPB). The dataset comes from the October 2025 DataDNA Consumer Financial Complaints Analytics Challenge hosted by Onyx Data DNA. The challenge had already closed, but the dataset was too compelling to ignore, so I analysed it independently to find where the system is failing everyday people.
Problem statement
Three questions drove the analysis:
- Where are the most common breakdowns occurring between consumers and financial institutions?
- Are companies responding to complaints effectively and on time?
- Which financial products, regions and companies show the highest consumer dissatisfaction?
About the dataset
- Volume: 62,516 complaints.
- Scope: 320 companies across 51 U.S. states.
- Products: nine main product categories, including Account, Card, Mortgage and Loan.
- Source: the official CFPB consumer complaint dataset, published to keep the financial sector transparent and accountable.
The dashboard
Five pages: Overview, Geography, Companies, Products and Resolution, each with its own filters.

Insights from the analysis
Key performance indicators

- 60,000+ complaints: a significant level of consumer frustration.
- 94% timely response rate: strong on regulatory compliance.
- 15 days average response time: a two-week turnaround. Compliant, but not fast.
- 1,226 average complaints per state: the issues are nationwide.
1. Top issues by total complaints

"Managing an account" generates more than 15,000 complaints, triple the next issue. That points to a fundamental breakdown in the day-to-day banking experience.
2. Complaint volume by product

Basic accounts make up 39.7% of complaints and credit cards 25.9%. Together they drive nearly two-thirds of the total. More complex products such as mortgages and loans generate proportionally fewer.
3. Complaints by census region

The Southern U.S. accounts for 37.8% of all complaints, a far higher share than any other region, which suggests regional economic or service-level challenges.
4. Complaints by company size

Large companies are responsible for 70% of all complaints. Consumer frustration is disproportionately linked to the industry's largest players.
5. Timely response rate by product

Personal Credit complaints get a timely response 91% of the time and Loan complaints 92%. The more complex the product, the slower the resolution.
6. Timely response rate by channel

The Web Referral channel has an 88% timely response rate, the lowest of the major channels. That is a specific bottleneck in digital complaint handling.
7. Total complaints by company response

More than 41,000 cases were closed with an "Explanation". "Monetary relief" was given roughly one-third as often. The system favours justification over tangible resolution.
Recommendations
Prioritise account management fixes
Overhaul the digital and service experience for everyday banking to address about 40% of complaints.
Audit large companies
Apply stricter examinations and enforcement to the companies responsible for 70% of complaints.
Investigate regional hotspots
Dig into the Southern (and Western) U.S. to understand what drives their complaint volumes.
Improve complex product handling
Create specialised teams and streamlined processes for Personal Credit and Loan complaints to lift the 91% to 92% timely response rates.
Fix the Web Referral bottleneck
Audit and optimise complaint handling for the channel with the lowest timely rate (88%).
Move beyond explanations
Set clearer resolution standards that require tangible relief, monetary or non-monetary, instead of closing a case with an explanation alone.
Conclusion
The U.S. financial system is failing consumers on fundamentals. The bulk of complaints come from basic failures in everyday banking and from the practices of large companies. The system is reliable at logging and closing complaints, but slow and ineffective at delivering satisfactory outcomes. The path forward is for regulators to target the worst-performing companies and regions, and for the industry to fix its core account management services. True accountability means solving problems, not merely explaining them.
Tools used
- MS Excel for data cleaning and preparation.
- Power BI for analysis and visualisation.
- Figma for background design and layout.
More work
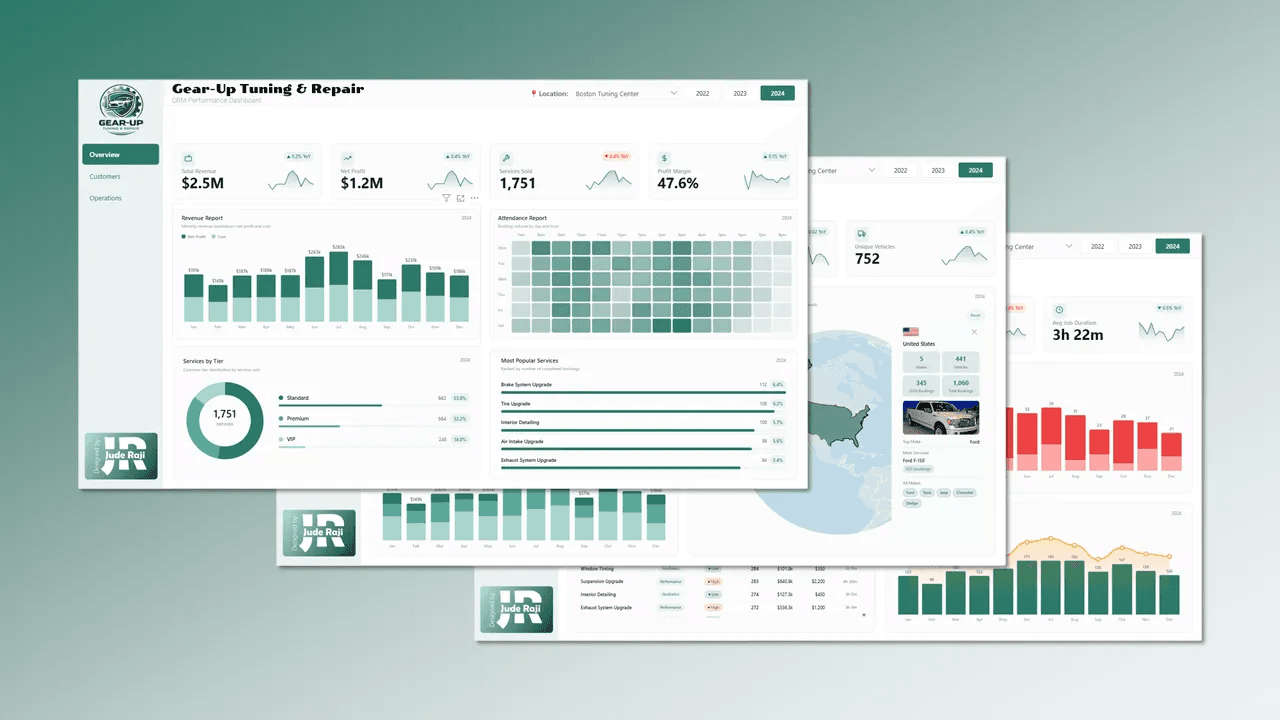
Gear-Up Auto Tuning & Repair
A three-page CRM dashboard covering revenue, customers and workshop operations for a multi-location auto repair business.
Power BI · DAX · HTML5 custom visuals · Figma
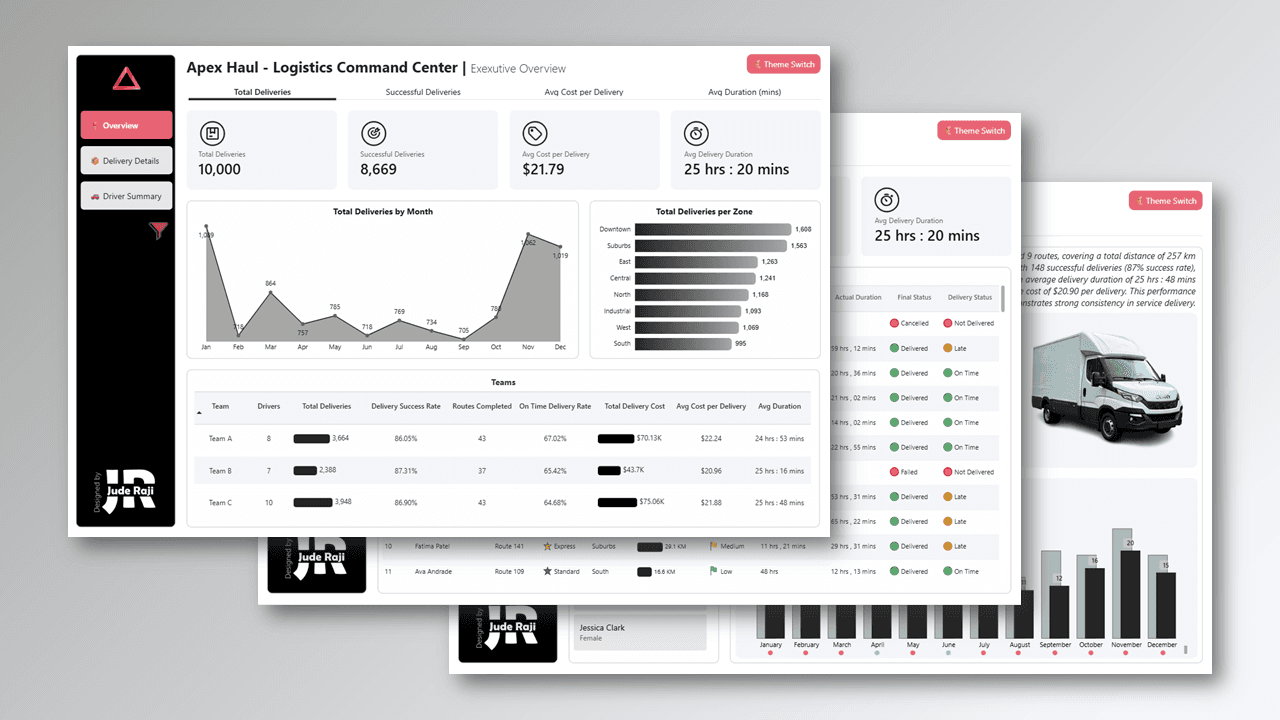
Apex Haul Logistics Command Center
An executive logistics dashboard covering 10,000 deliveries, driver performance and zone analytics.
Power BI · Python · Figma
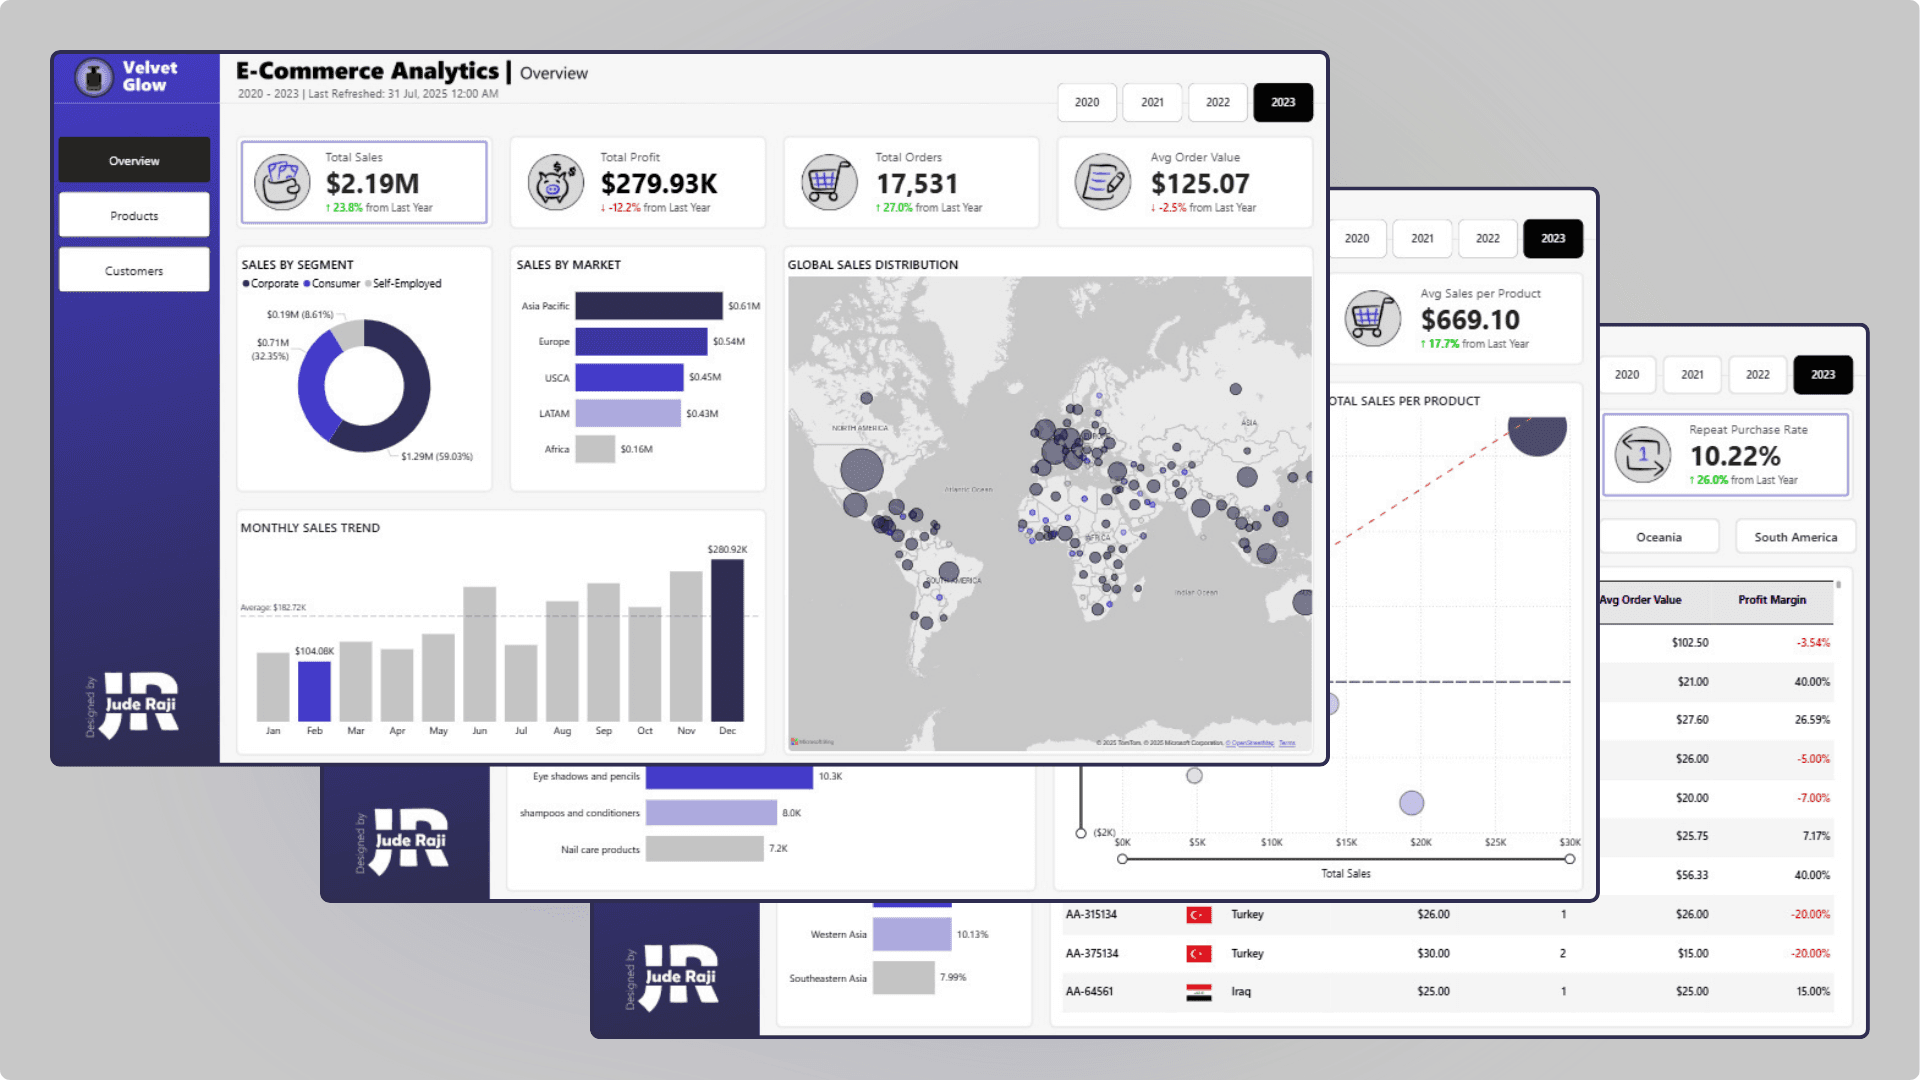
Velvet Glow E-Commerce Analytics
Sales, product and customer analytics for a global skincare and beauty retailer, built to tackle retention and profitability.
Power BI · Excel · Figma